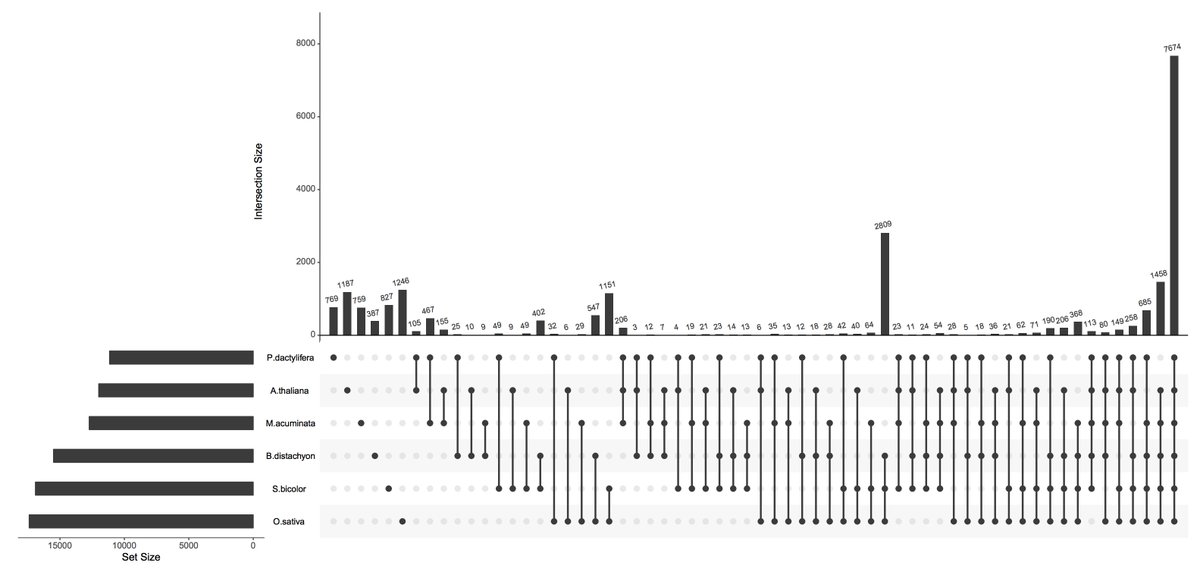
For decades Venn diagrams (created by John Venn in 1880) have been a primary way to show set intersections. Although Venn diagrams are very useful in set theory but not scalable if the number of sets increases more than four, it is very difficult to understand them. Also, it’s not possible to show more than 6 sets in a Venn diagram. For example, the below six-way Venn diagram shows the distribution of shared gene families among six genomes, taken from D’Hont et al. (2012) Nature, is very complicated to understand.

An alternative approach, named UpSet, was introduced by Nils Gehlenborg’s lab at Harvard Medical School to depict the intersection of more than three sets. The advantage of UpSet plots is their capacity to rank the intersections and alternatively hide combinations without intersection, which is not possible using a Venn diagram. There is also an awesome R package UpSetR. Below, the above Venn diagram was turned into UpSet, and it looks cool and easy to find where are highest intersections. To know more about UpSet plots, it’s recommended to read Nils slides.
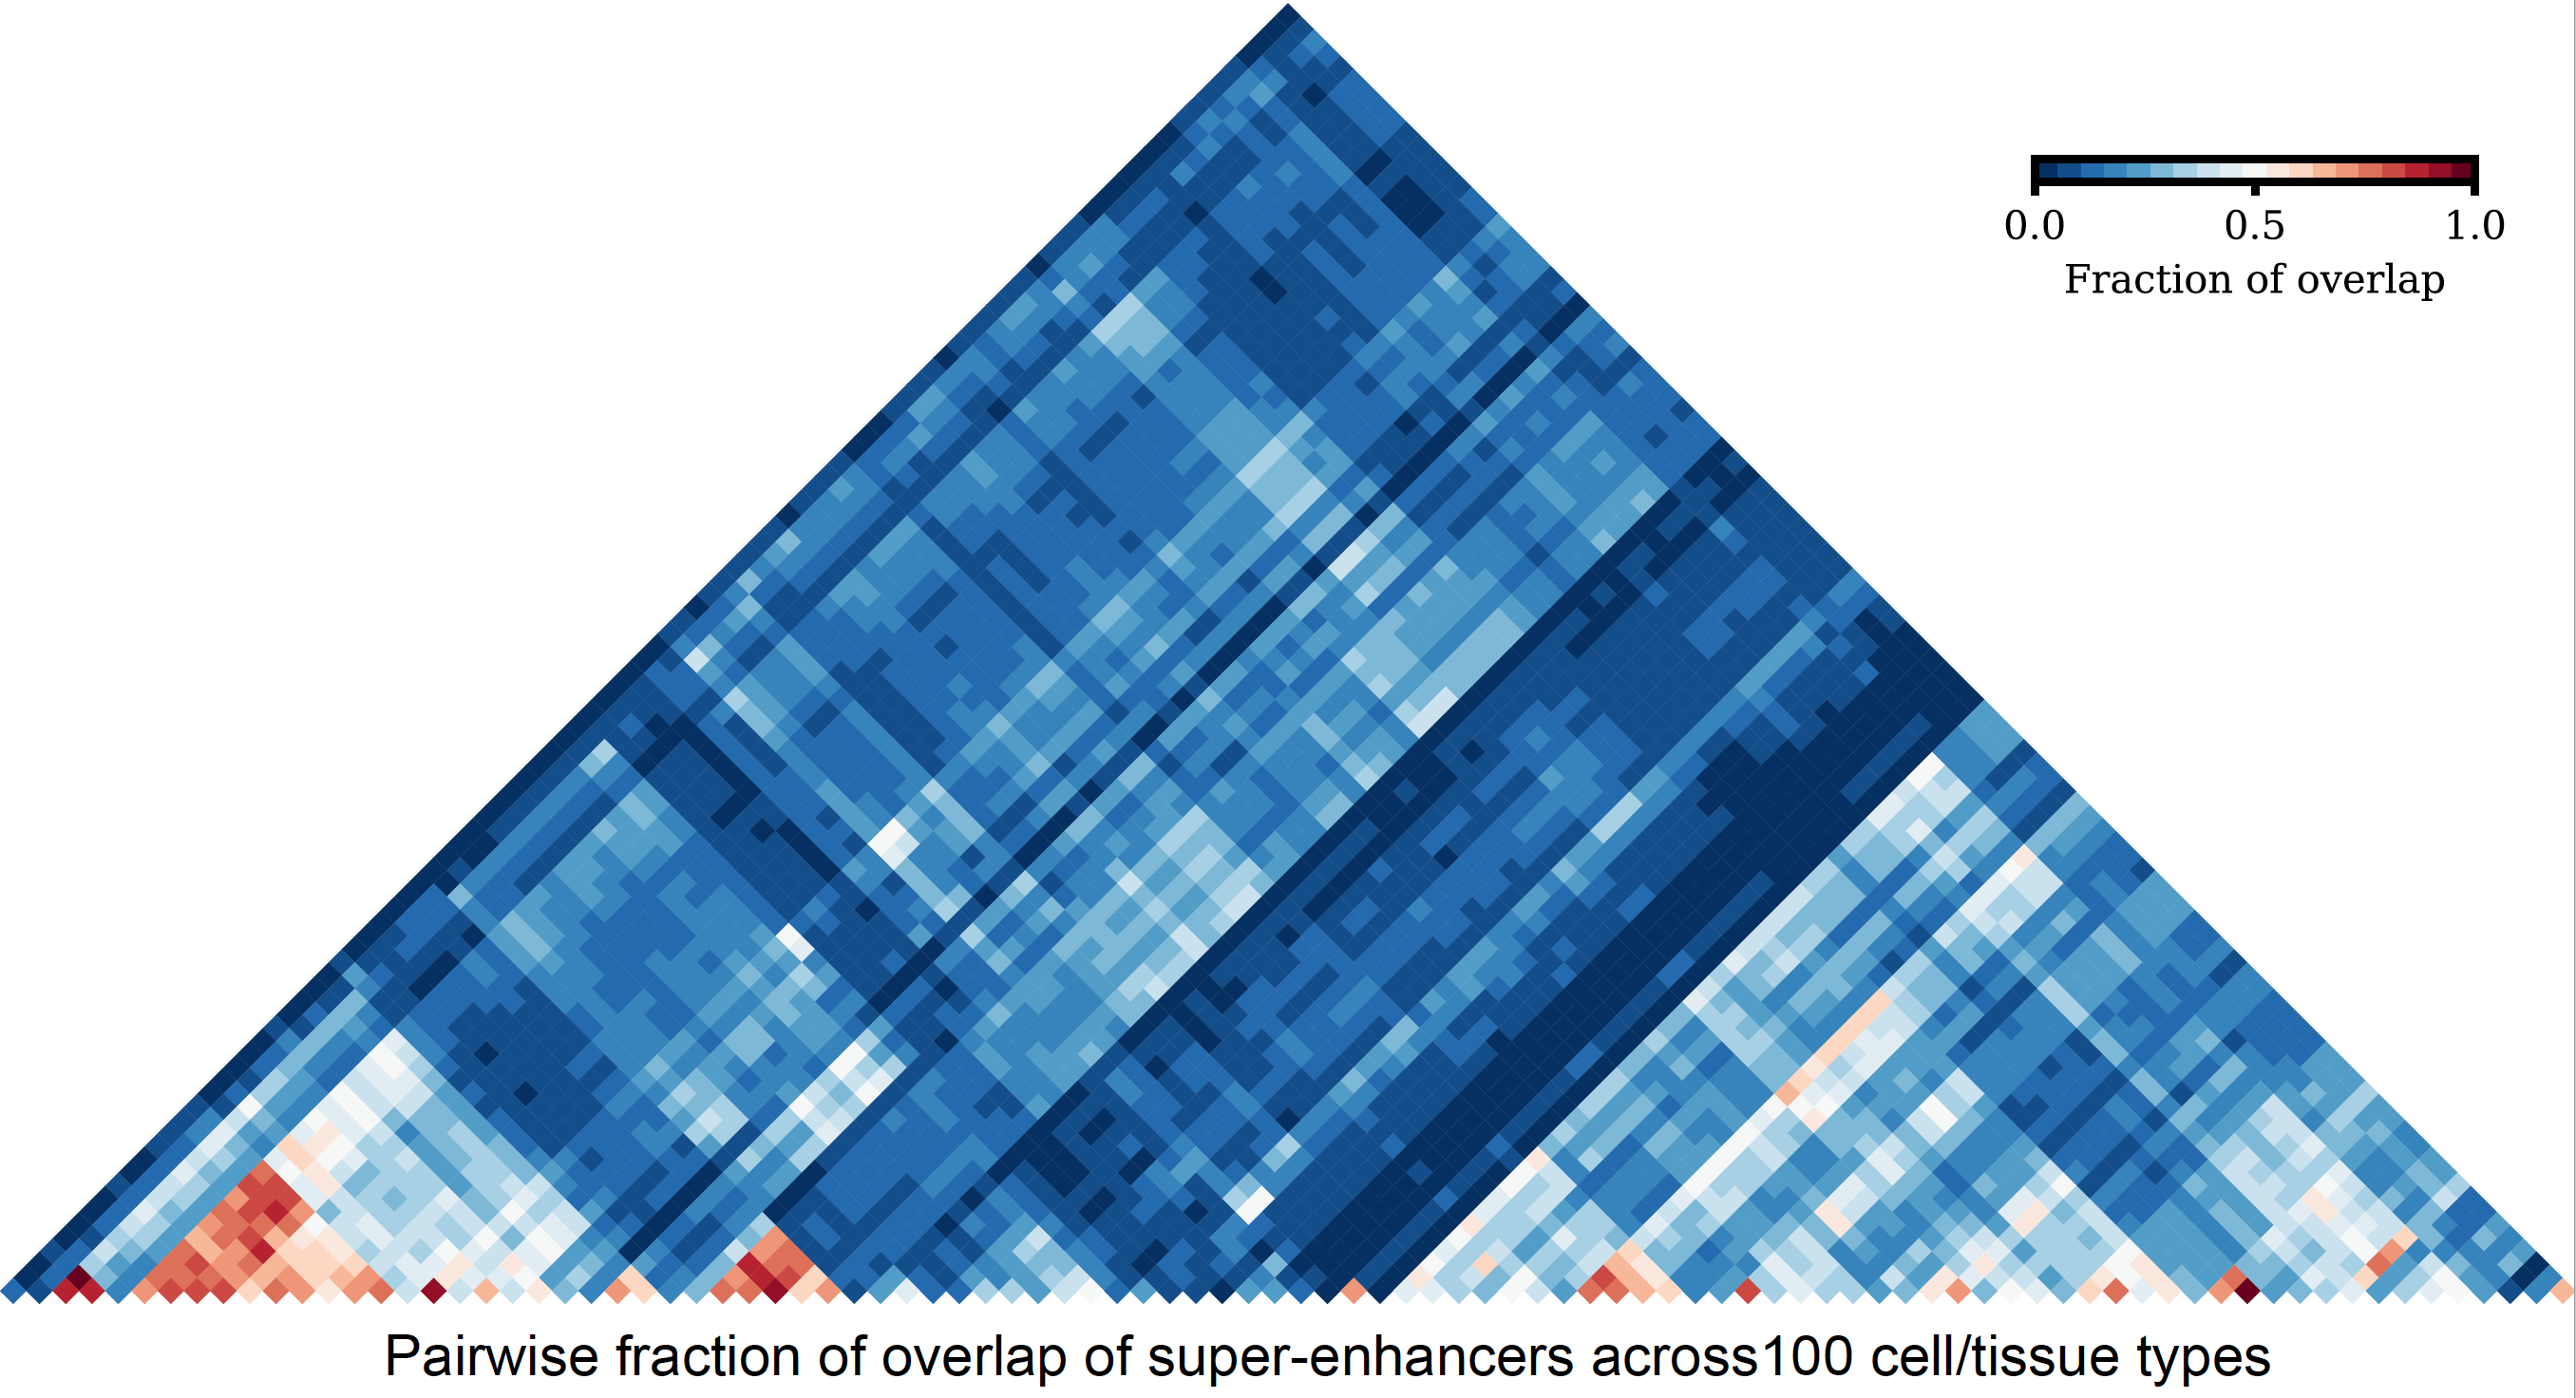
However, with a large number of sets, UpSet plots also become an ineffective way of illustrating set intersections. To visualize a large number of sets, one can represent pairwise intersections using a clustered heatmap.
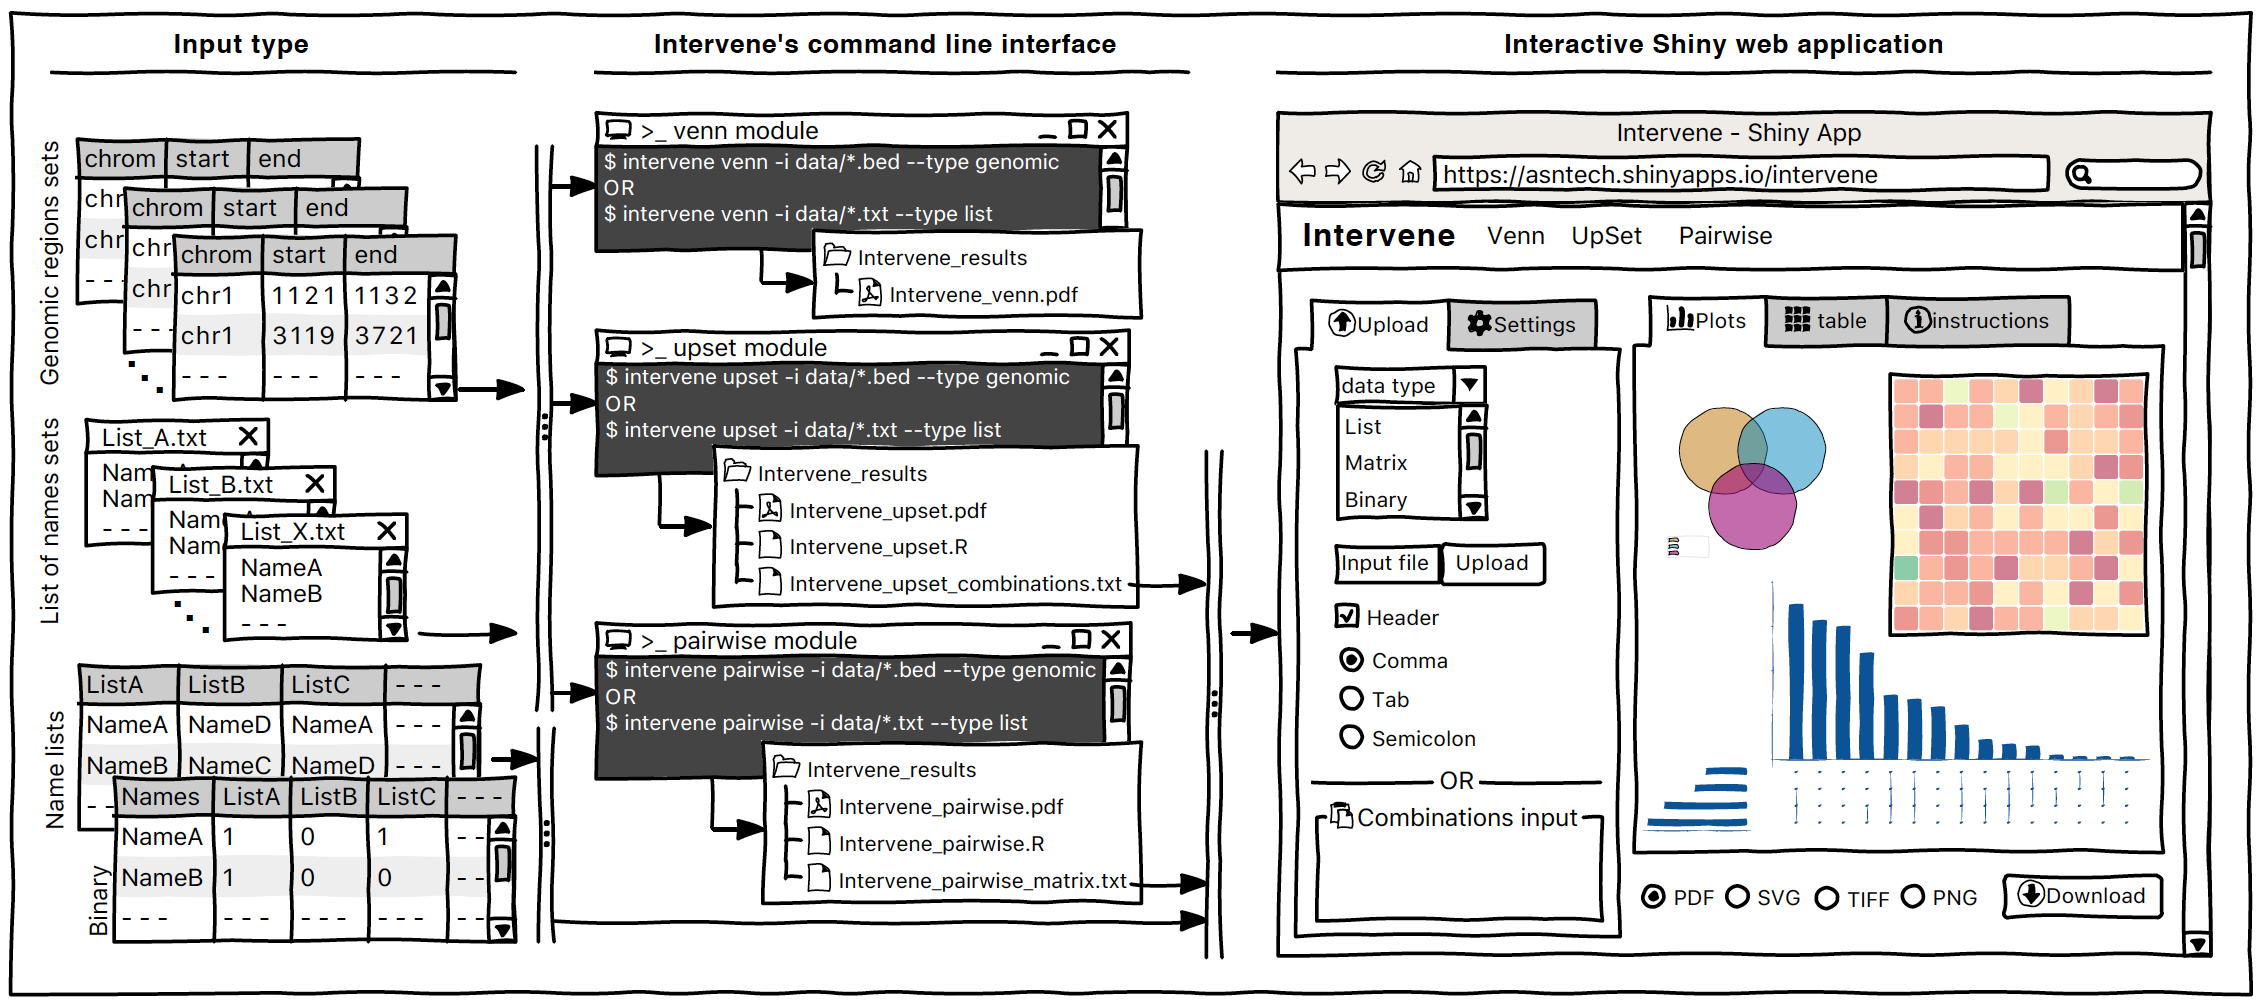
To have these three options in one tool, we developed ‘Intervene’, for effective intersection and visualization of genomic regions or name list sets and to generate publication-quality figures. Intervene has 3 modules:
- upset to generate UpSet plots of multiple sets,
- pairwise to compute and visualize intersections of multiple sets as clustered heat maps, and
- venn to generate Venn diagrams of up to six sets (for folks who still love Venn diagrams)
Intervene comes with a Python-based command line interface, which can easily be installed through bioconda
conda install -c bioconda intervene
Or through PyPi
pip install intervene
The source code is freely available on GitHub and Bitbucket
GitHub: https://github.com/asntech/intervene
Bitbucket: https://bitbucket.org/CBGR/intervene
I also developed an interactive Shiny web application which is available at:
For more details, you can read our manuscript which appeared in the journal BMC Bioinformatics
Khan A., and Mathelier A. (2017) Intervene: a tool for intersection and visualization of multiple gene or genomic region sets, BMC Bioinformatics. 18(1):287. doi:10.1186/s12859-017-1708-7